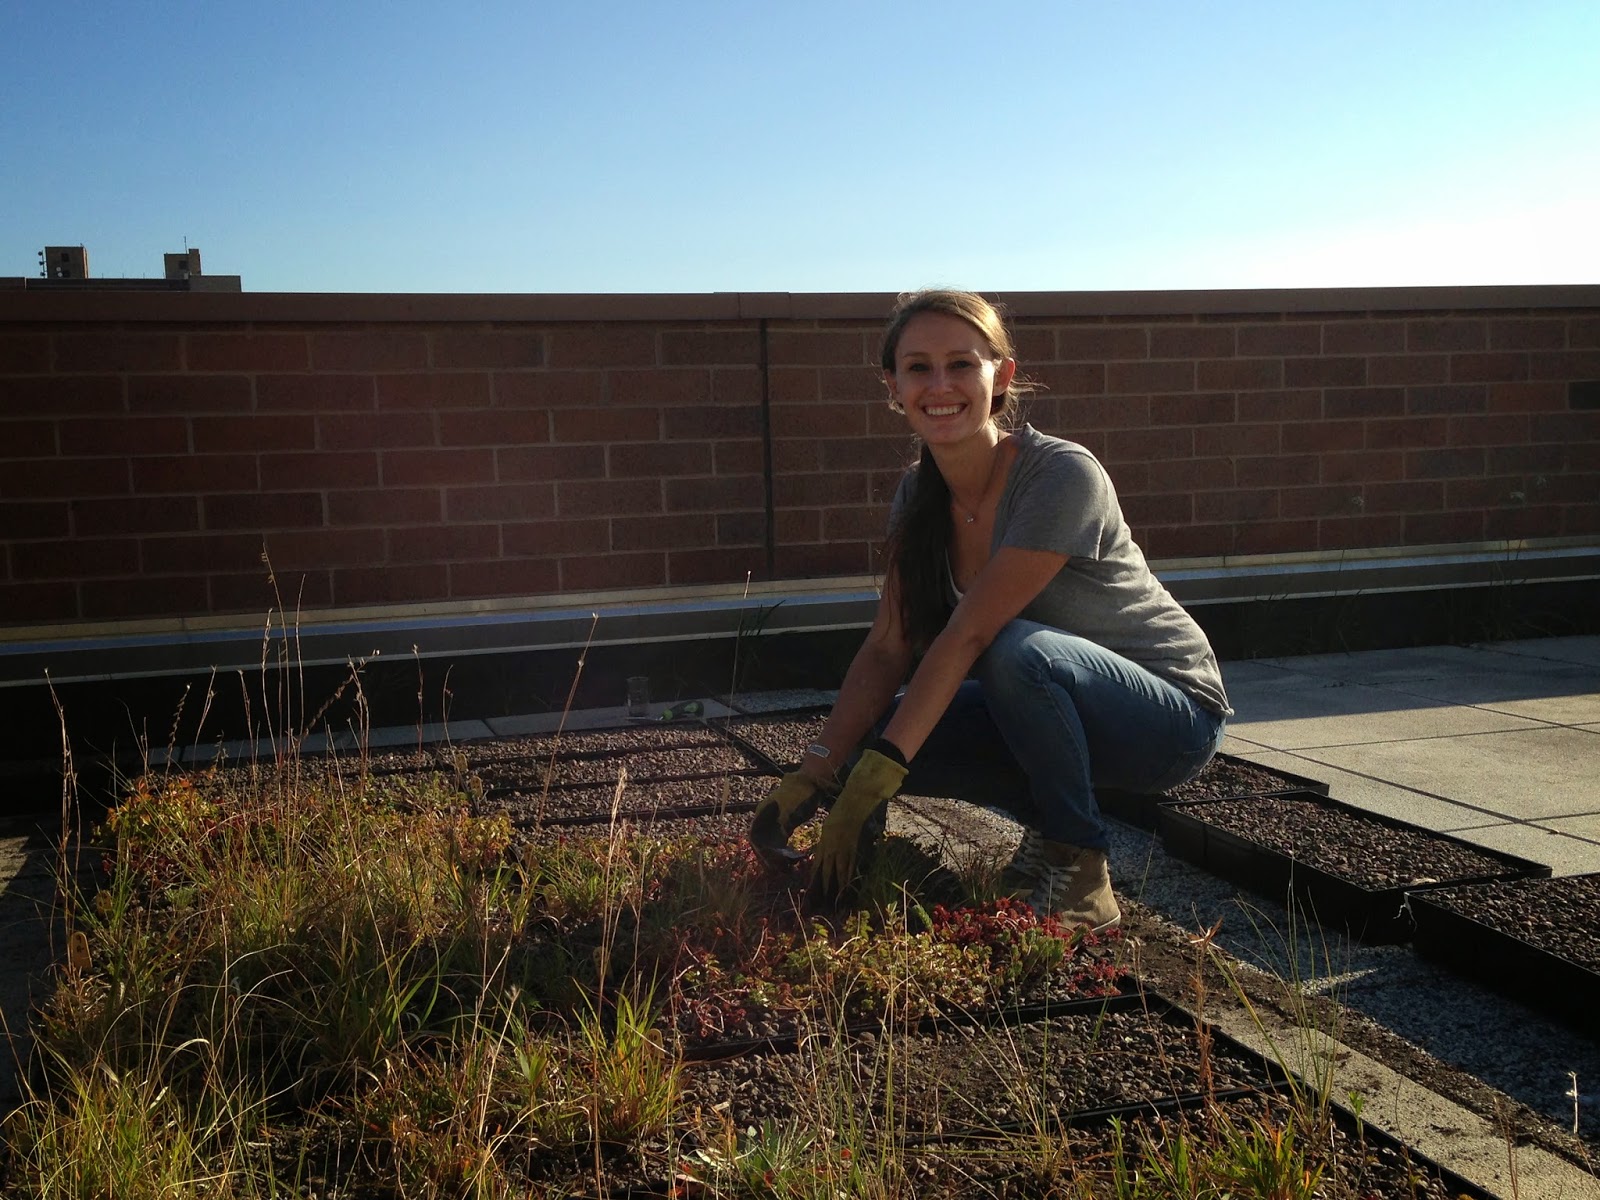
It has been awhile since the research symposium and I realized I needed to share my final presentation with you! The symposium went very well and I was very excited to share my results from my time researching green roofs! Here it is:
Sunday, January 10, 2016
Sunday, April 12, 2015
Preparing for the Research Symposium
Hello!
I know it has been awhile, but I've been busy trying to analyze my data and get my presentation ready for the upcoming Research Symposium which is happening this Saturday!
To catch you up on a few things...Dr. Ohsowski, a professor that specializes in restoration and conservation, graciously agreed to help me analyze my data. He helped me run a linear fixed effects model on the temperature data of our experimental green roof trays. The results indicated that the addition of fungi caused the experimental green roof trays to be warmer than the bare roof in summer and colder than the bare roof in winter. Additionally, sedum was the only plant treatment able to keep the trays colder than the bare roof in the summer and warmer than the bare roof in the winter.
We think that perhaps the addition of fungi to our trays caused the trays to not perform as well as the trays without the fungi in terms of heat reduction and insulation because of the extra metabolic processes the fungi was carrying out. Also, the native plant treatments did not have as much coverage as the sedum (the native plants had around 50% coverage while the sedum had around 80% coverage on average). We think that this may have given sedum an advantage over the native plants in its ability to heat and cool the green roof. Currently, the results do not take this factor in to account. In the future, plant coverage could be accounted for in our calculations.
So this week I will be working on fixing up my presentation which I performed last week to my lab group who gave me a lot of feedback. I'm very excited for the symposium, and I can't wait to share my presentation with you once it is edited! Not too much longer!...
Until then...
I know it has been awhile, but I've been busy trying to analyze my data and get my presentation ready for the upcoming Research Symposium which is happening this Saturday!
To catch you up on a few things...Dr. Ohsowski, a professor that specializes in restoration and conservation, graciously agreed to help me analyze my data. He helped me run a linear fixed effects model on the temperature data of our experimental green roof trays. The results indicated that the addition of fungi caused the experimental green roof trays to be warmer than the bare roof in summer and colder than the bare roof in winter. Additionally, sedum was the only plant treatment able to keep the trays colder than the bare roof in the summer and warmer than the bare roof in the winter.
We think that perhaps the addition of fungi to our trays caused the trays to not perform as well as the trays without the fungi in terms of heat reduction and insulation because of the extra metabolic processes the fungi was carrying out. Also, the native plant treatments did not have as much coverage as the sedum (the native plants had around 50% coverage while the sedum had around 80% coverage on average). We think that this may have given sedum an advantage over the native plants in its ability to heat and cool the green roof. Currently, the results do not take this factor in to account. In the future, plant coverage could be accounted for in our calculations.
So this week I will be working on fixing up my presentation which I performed last week to my lab group who gave me a lot of feedback. I'm very excited for the symposium, and I can't wait to share my presentation with you once it is edited! Not too much longer!...
Until then...
Thursday, February 5, 2015
R Stats Package
Last week Dr. Ohsowski, a professor at Loyola, gave our lab group a nice introduction to R. This week, I have tried to learn a little more about R and to begin analyzing my data in R, but I'm having a hard time. I am hoping to get a little more guidance apart from the internet at this point. I hope by next week I will be back on my way. Until then, I will continue to fight the internet for help!
Wish me luck!
Wish me luck!
Thursday, January 22, 2015
Spring 2015 Semester Has Begun!
Welcome back!
The last semester of my college career has begun! I am both happy, sad, terrified and excited for what is next to come. Until then though, I have a lot left to do! This semester I have to analyze all of the temperature and water retention data I have collected on our experimental trays. I am tackling the temperature data first. This week I am compiling all of the data into one excel file and then double checking that it is correct. I will then begin to take monthly averages of our different treatments and compare them. I will do a lot of analysis with this data eventually but this sounded like a good start.
Additionally, I need to share some pictures with you! Over winter break, Kelly and I took out the ibuttons, collected their data, reset them, and replaced them in their locations. At the CBG experimental site we had a tough time. The soil was frozen over so we tried warming the soil up with a hair dryer which didn't end up working. We ended up working really hard to dig down into the soil with a spoon. We were successful.
The last semester of my college career has begun! I am both happy, sad, terrified and excited for what is next to come. Until then though, I have a lot left to do! This semester I have to analyze all of the temperature and water retention data I have collected on our experimental trays. I am tackling the temperature data first. This week I am compiling all of the data into one excel file and then double checking that it is correct. I will then begin to take monthly averages of our different treatments and compare them. I will do a lot of analysis with this data eventually but this sounded like a good start.
Additionally, I need to share some pictures with you! Over winter break, Kelly and I took out the ibuttons, collected their data, reset them, and replaced them in their locations. At the CBG experimental site we had a tough time. The soil was frozen over so we tried warming the soil up with a hair dryer which didn't end up working. We ended up working really hard to dig down into the soil with a spoon. We were successful.
| CBG Experimental Site |
| CBG - isn't it beautiful? |
| LUC Experimental Site |
| Working hard despite the cold Despite the green roofs taking time to hibernate, a lot of work must be done. Here I go! |
Tuesday, December 16, 2014
Measuring Water-Holding Capacity and the Fall Semester is Complete!
Good news! I have measured the water-holding capacity of all 80 soil samples from both the Loyola and Chicago Botanic garden sites! Here are the results (more to come later on what this all actually means!):
I've also completed the Fall semester of my senior year! I have one more to go, and I will be continuing research next semester! Next semester, I will focus on learning the statistical package R and analyzing all the temperature and water-holding capacity data. I will present my results in a poster format and possibly a presentation in the Spring at the Undergraduate Research Symposium during Loyola's annual Weekend of Excellence. More to come on this later!
Tomorrow and the next day, Kelly and I are going to take out and reset the i-buttons at both of our experimental sites before the harsh part of winter freezes them in the soil. I will take pictures to show you all what the other site looks like. Until then!
Happy Holidays!
Signing off...
![]() |
| Graph of Primary Results of Measuring Water-holding Capacity |
Tomorrow and the next day, Kelly and I are going to take out and reset the i-buttons at both of our experimental sites before the harsh part of winter freezes them in the soil. I will take pictures to show you all what the other site looks like. Until then!
Happy Holidays!
Signing off...
Thursday, November 20, 2014
More on Measuring Water-Holding Capacity
I am working hard to measure all of the water-holding capacities of the different experimental trays. I've gotten through over a 1/4 of all the 80 trays! Here is a graph of the first 25 trays from the Loyola experimental site.
For both Prairie A and Prairie B, adding native inoculum increased water-holding capacity. However, it did not increase it significantly. Once all the trays have been completed, I am going to do significance tests in R with the data so more to come later of the results and analysis of the results.
Have a great thanksgiving!
For both Prairie A and Prairie B, adding native inoculum increased water-holding capacity. However, it did not increase it significantly. Once all the trays have been completed, I am going to do significance tests in R with the data so more to come later of the results and analysis of the results.
Have a great thanksgiving!
Thursday, October 30, 2014
Measuring Water-holding Capacity
I've begun taking water-holding capacity tests for all of our experimental trays! The process took some thinking to develop, but once we nailed it down, it was pretty easy going.
The procedure is:
I've already gotten through the first 10 trays which are all Prairie A native plants. The first five are with added native inoculum, the next five are added with sterilized inoculum. The average water holding capacity of the added native inoculated soils was higher than the average of the sterilized inoculated soils for Prairie A! This is great news because for the Prairie A, the addition of native inoculum improved storm water retention!
More results to come later!
![]() |
| Measuring water-holding capacity |
The procedure is:
I. Drying
Soil
1. Heat up soil drying oven to 105ºC for an
hour
2. Take bag of soil out of freezer and let
thaw
3. Sample 45 ml of soil and place in
aluminum weight boat
4. Place remaining soil in bag back in
freezer
5. Place the aluminum weigh boat with soil
in drying oven
6. Dry for at least 48 hours
7. Remove weigh boat and place in desiccator
if not used immediately
II. Measuring
Water-holding Capacity
1. Measure and record 40 ml of dried soil
alone in a tared weigh boat
2. Wet a folded filter paper by submerging
entirely in a water bath
3. Let the wet filter paper drain for one
minute until it is no longer dripping
4. Weigh and record the wet filter paper
alone in a tared weigh boat
5. Add the soil to the wet filter paper
6. Add 50 ml of water slowly and all over to
the soil
7. Repeat step 6 two times
8. Wait three minutes for the water to drain
until it is no longer dripping
9. Weigh and record wet soil in the wet
filter paper in a tared weigh boat
10. Measure and record volume of water that filtered
through
I've already gotten through the first 10 trays which are all Prairie A native plants. The first five are with added native inoculum, the next five are added with sterilized inoculum. The average water holding capacity of the added native inoculated soils was higher than the average of the sterilized inoculated soils for Prairie A! This is great news because for the Prairie A, the addition of native inoculum improved storm water retention!
More results to come later!
Tuesday, October 14, 2014
I-button data collection and soil sampling
| Green roof in September |
| Putting the ibuttons back and collecting soil |
The last week of September was big week for us! Dr. Chaudhary and I collected all of the ibuttons from their experimental trays and downloaded the data off of them. Then, Kelly and I restarted their missions and placed them back in their locations. Sarah and I also took soil samples from each tray to begin doing tests on the soil. I will do water-holding capacity tests and Sarah will analyze for carbon! I am currently researching water-holding capacity methods and will hopefully have news on that in the next two weeks. Until then, I am going to start compiling the temperature data from the ibuttons!
Here are some pictures from the big day! Yay data!
Tuesday, September 2, 2014
Fall Semester
The Fall semester of my senior year has begun!
More importantly, I will be continuing the research I began over the summer for credit this semester! I am also happy to say my partner in crime, Sarah, will be continuing research with me! She and I will be meeting with Dr. Chaudhary and other students working on lab related projects regularly in a small lab group meeting. My main goals for the semester are:
![]() |
| I'm sorry I couldn't resist inserting one of my favorite Michael Scott moments... |
- Collect the ibutton data in September, reset the ibuttons, replace them back outside in their experimental postions and then analyze the data
- If I have time, I will analyze the data with R, a statistical package, and compare it with daily temperature/precipitation data. This will provide us with a little more information on transpiration rate. If the temperature varies within the trays after rainfall, we will know that the cooler trays have the ability to not loose water as quickly as the other warmer trays.
- Sample soil from experimental trays and measure water holding capacity of the different soils
- Once collected, the soil is inundated with water using a can and filter setup. The soaked soil is weighed and then dried in an oven and then weighed once dry. The difference is the water-holding capacity in ml of water per gram of soil.
- Complete my prospectus, which I will share with you of course!
Measuring soil stablity - sieving soil!
A few weeks ago, Sarah and I measured the soil stability of each of our experimental trays. That meant that we collected a soil aggregate (a very small clump of soil particles) very carefully from each tray. Each soil aggregate was placed in a sieve basket. I am going to take this opportunity now to finally mention what sieving is (since it is in the title of my blog and all)! Sieving through soil is essentially separating the soil by particle size. In our slake test, we want to know how fast the soil sieves apart. We do this by placing it in water once its in its sieve basket. This will tell us a little bit about the stability of the soil aggregate (or ped), or its ability to resist breakdown by water.
The sieve with the soil aggregate is placed in water for 5 minutes and examined for signs of dissolution. If the aggregate of soil makes it past 5 minutes without completely dissolving, it is then dunked 5 times. Throughout the test, a soil stability class is assigned.
Assigning soil stability class:
The results were great! The average soil stability class was 4.43 with a standard deviation of 1.34! These results will be analyzed further to draw conclusions about the soil stability class of our different treatments. The results will also be analyzed in comparison with other data we gather on the trays to start making informed conclusions about whether green roofs with native plants and/or added native arbuscular mycorrhizal fungi perform as health natural habitats and improve heat insulation and storm water retention. More to come later!
Assigning soil stability class:
- If the soil is not even stable enough to sample, the soil stability class is 0 (which is really, really bad - the soil will not resist erosion to wind or water).
- If 50% of the structural integrity is lost within 5 seconds of inserting the ped into water, the soil stability class is 1 (pretty bad).
- If 50% of the structural integrity is lost within 5-30 seconds of insertion in water, the soil stability class is 2 (ok).
- If 50% of the structural integrity is lost within 30 - 300 seconds after insertion or <10% of the soil remains on the sieve after 5 dipping cycles, the soil stability class is 3 (good).
- If there is 10 - 25% of the soil remaining on the sieve after 5 dipping cycles, the class is 4 (pretty good).
- If there is 25 - 75% of the soil remaining on the sieve after 5 dipping cycles, the soil stability class is 5 (really good).
- If there is 75 - 100% of the soil remaining on the sieve after 5 dipping cycles, the soil stability class is 6 (REALLY GOOD i.e. make sure you don't have a rock instead of a soil aggregate!)
![]() |
| But we love doing it! |
| Finding peds is hard |
The results were great! The average soil stability class was 4.43 with a standard deviation of 1.34! These results will be analyzed further to draw conclusions about the soil stability class of our different treatments. The results will also be analyzed in comparison with other data we gather on the trays to start making informed conclusions about whether green roofs with native plants and/or added native arbuscular mycorrhizal fungi perform as health natural habitats and improve heat insulation and storm water retention. More to come later!
Thursday, July 17, 2014
Staining & mounting roots
The next step in the analysis of the roots harvested from the MIP is staining and mounting. The 0.15 grams of roots from each corn plant grown in our different treatments of soil was placed in a small cassette and then placed in boiling 10 % KOH for 3-5 minutes. The potassium hydroxide clears the roots of the cellular contents of their cortical cells so that the fungi, which lives inside the roots, can be seen better. The fungus isn't killed because the fungus is made of chitin which is very recalcitrant and resists breakdown.
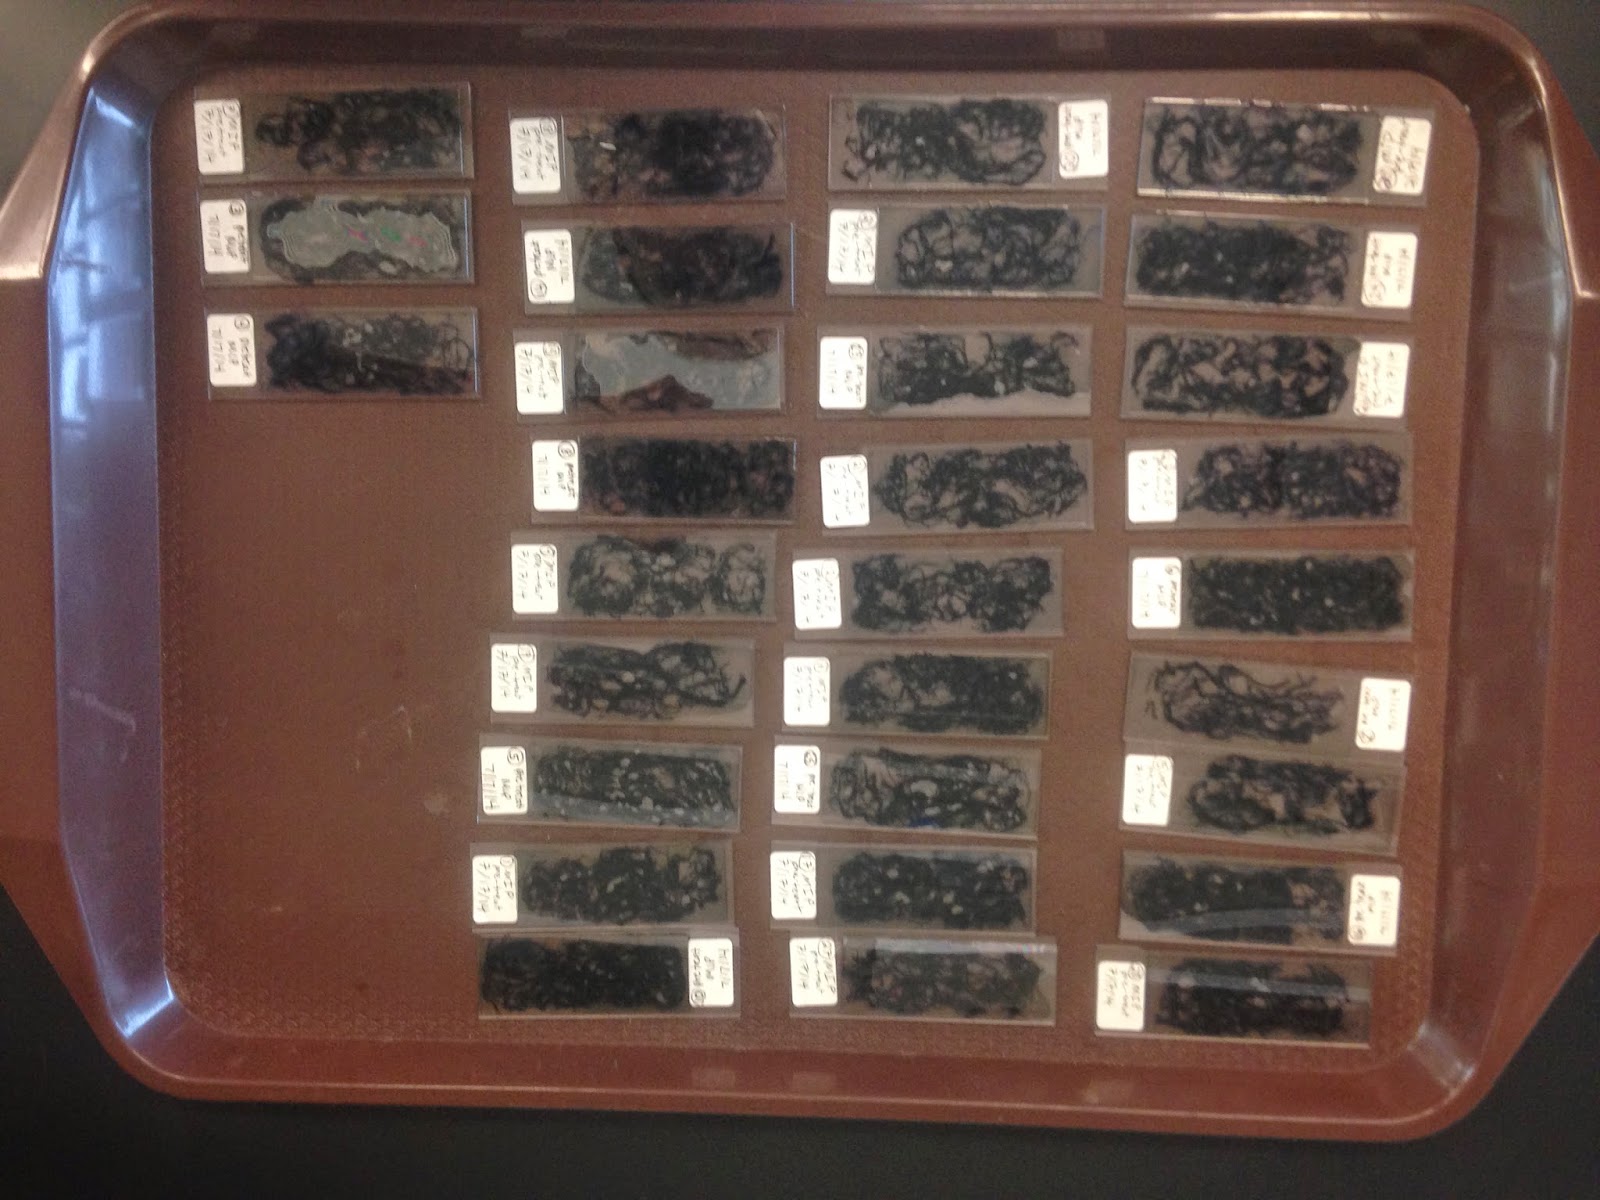
The next step after the roots have been boiled in KOH is to place them in boiling 5 % ink in vinegar solution for 3 minutes. After this step has been completed, the fungi inside of the roots will have been stained and will be completely visible under a microscope. The roots are then mounted in PVLG on a microscope slide to be viewed.
And finally our roots are ready to be examined for mycorrhizal fungi!
| KOH and ink in vinegar solution |
| Roots in boiling KOH |
| Dr. Chaudhary's perfect example slide |
| All of our roots stained and mounted |
MIP Harvest
In other great news, the MIP* was harvested just after the corn plants matured enough to develop significant relationships with potential mycorrhizal fungi in the soil. The corn plants were grown in order to look at how our different soil treatments varied in terms of the presence of mycorrhizal fungi. Did the native inoculum truly have mycorrhizal fungi? Was the sterilized soil truly sterile? In addition to confirming our treatments, analyzing the MIP also provides a baseline, or a starting point, of how much mycorrhizal fungi was present before we started our experiment.
| The MIP just before harvest |
As a reminder, our green roof experiment has several different treatments of soil and we want to analyze if and how mycorrhizal fungi benefits a green roof.
In order to analyze the mycorrhizal fungi in the soil, the roots have to be harvested since the fungi live inside the roots. But first, the above ground biomass is harvested, dried and weighed. Obviously, the plants with the most above ground biomass were the strongest and healthiest. We want to quantify the above ground biomass as a confirmation our results of the below ground biomass.
After harvesting the above ground biomass, the below ground biomass, or the roots, are left in their respective "conetainers" and then are placed in the freezer until we are ready to begin washing the roots. The freezer halts any decomposition that may be happening in the soil which could artificially lower our results. Once the roots are ready to be washed, they are taken out of the freezer and placed in a series of water baths to ensure that the roots are clean and not "being weighed down" by any extra soil, which would also skew our results.
Once the roots are washed, 0.15 grams is weighed out to be stained and placed on a slide. The roots are first cut into 4-5 1" sections where roots are taken from each section in an effort to sample in a stratified manner. These roots will be examined under a slide for mycorrhizal fungi relationships. The rest of the roots are weighed and dried to determine the below ground biomass weight.
![]() |
| Sarah cutting corn roots into sections |
This very time consuming process will tell us everything we need to know about the health and virility of our different soils; it will quantify the amount of mycorrhizal fungi in our different soils.
*For more information on what the MIP is, please refer to my first blog post :)
Thursday, July 3, 2014
I-buttons/Thermotrons!
Great news on the green roof research front! I have been diligently working to figure out how ibuttons, small computer chips that record temperature readings, work in order to begin collecting temperature data on our green roof. We want to record the temperatures inside the different trays of different soils in order to make conclusions about whether green roofs with native plants and/or added arbuscular mycorrhizal fungi improve heat insulation. In order to know this, we need to track the soil temperature at different times in the different soils. We will also compare it to the temperature on the green roof surface as a control. Luckily, we have little ibuttons, or thermotrons as Sarah and I have named them, to help us out.
I have been performing small experiments on all of our ibuttons in order to verify that they take the exact same temperature reading while in the same environment. In order to set the experiment up, the ibuttons must be set on a mission (Sarah and I didn't make up that term, I know shocking). However, you cannot set a start time for all the ibuttons (we really wish we could). We want to start all the ibuttons at the exact same time so time is not a variable when analyzing the results. In order to do this, you have to set a mission time delay...This means that if you have 26 ibuttons it will take 26 minutes to set them up. The first ibutton mission time delay should be set at 26 minutes, the second at 25, the third at 24, etc. so all the ibuttons will start their mission at the same time.
The next step in the small experiment I did was to place all the ibuttons in different environments, such as at room temperature, in the fridge, in the freezer, and on top of the green roof. Then, I analyzed the data. If all of the ibuttons took temperature readings at exactly the same time, then they should all have the exact same temperature readings in the different environments.
The results were great. I calculated the averages and standard deviations for each of the ibutton's temperature readings at the different times. The standard deviations were for the most part below 1, with only a few above 1.
This gave us enough confidence that our trusty ibuttons were able to do their job correctly. So, this morning Sarah and I set all the ibuttons to start their mission at 5:00 PM today. This gave us enough time to bury all the ibuttons about halfway down in the soil in the middle of the selected trays (the trays were selected randomly).
Here are the trusty ibuttons ready to start their mission!
The ibuttons were placed in a plastic bag because unfortunately they are not water proof. While the plastic bag may affect the temperature reading slightly, all of the ibuttons are in a plastic bag, so all the temperature readings will be affected in the exact same way. The small piece of paper labeled each ibutton's location and ID. The ibuttons are able to store 2,048 temperature readings. We set the ibuttons to take a temperature reading every hour. That means we will be able to leave the ibuttons out on the roof until late September when we will have to take them back inside to retrieve data and restart their missions .
I have been performing small experiments on all of our ibuttons in order to verify that they take the exact same temperature reading while in the same environment. In order to set the experiment up, the ibuttons must be set on a mission (Sarah and I didn't make up that term, I know shocking). However, you cannot set a start time for all the ibuttons (we really wish we could). We want to start all the ibuttons at the exact same time so time is not a variable when analyzing the results. In order to do this, you have to set a mission time delay...This means that if you have 26 ibuttons it will take 26 minutes to set them up. The first ibutton mission time delay should be set at 26 minutes, the second at 25, the third at 24, etc. so all the ibuttons will start their mission at the same time.
The next step in the small experiment I did was to place all the ibuttons in different environments, such as at room temperature, in the fridge, in the freezer, and on top of the green roof. Then, I analyzed the data. If all of the ibuttons took temperature readings at exactly the same time, then they should all have the exact same temperature readings in the different environments.
The results were great. I calculated the averages and standard deviations for each of the ibutton's temperature readings at the different times. The standard deviations were for the most part below 1, with only a few above 1.
This gave us enough confidence that our trusty ibuttons were able to do their job correctly. So, this morning Sarah and I set all the ibuttons to start their mission at 5:00 PM today. This gave us enough time to bury all the ibuttons about halfway down in the soil in the middle of the selected trays (the trays were selected randomly).
Here are the trusty ibuttons ready to start their mission!
![]() |
| 26 ibuttons in plastic bags |
![]() |
| An ibutton ready to be buried alive! |
![]() |
| Me planting the ibuttons |
![]() |
| An ibutton being buried in a control tray |
![]() |
A control ibutton taped to the green roof
|
Subscribe to:
Posts (Atom)


.jpeg)
.jpeg)
.jpeg)

.jpeg)
.jpeg)